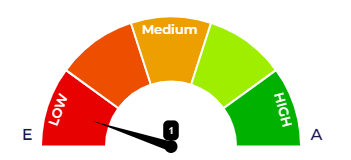
How To Create Chart Speedmeter
Hello guys, Today I will share How Create Chart Speedmeter.
HTML
<!DOCTYPE html>
<html lang="en-US">
<head>
  <script src="jQuery/jquery-3.4.1.min.js"></script>
  <meta charset="utf-8">
  <meta http-equiv="X-UA-Compatible" content="IE=Edge">
  <meta name="viewport" content="width=device-width, initial-scale=1">
  <title>Gauge Chart with datalabels plugin</title>
 <script src="https://unpkg.com/chart.js@2.8.0/dist/Chart.bundle.js"></script>
  <script src="https://unpkg.com/chartjs-gauge@0.3.0/dist/chartjs-gauge.js"></script></script>
</head>
<body>
  <div class="position-relative">
     <div id="canvas-holder" class="chart-gro-score">
       <span class="low-score">E</span>
           <canvas id="chart"></canvas>
       <span class="hight-score">A</span>
     </div>
      <div class="low-view">
        <h3>LOW</h3>
      </div>
      <div class="medium-view">
        <h3>Medium</h3>
      </div>
      <div class="high-view">
        <h3>HIGH</h3>
      </div>
   </div>
</body>
</html>
CSS
canvas {
  -moz-user-select: none;
  -webkit-user-select: none;
  -ms-user-select: none;
}
.position-relative{
   position: relative;
}
.chart-gro-score{
    width:80%;
    display: flex;
    align-items: flex-end;
}
.chart-gro-score span{
    padding-bottom: 30px;
    font-size: 16px;
    font-family: 'Montserrat-SemiBold';
    color: #1a1753;
}
.low-score{
    margin-right: -22px;
}
.hight-score{
    margin-left: -22px;
}
.low-view{
    position: absolute;
    bottom: 60px;
    left: 20px;
}
.low-view h3{
    font-size: 13px;
    font-family: 'Montserrat-SemiBold';
    color: #FFFFFF;
    -ms-transform: rotate(-70deg);
    transform: rotate(-70deg);
}
.medium-view{
    position: absolute;
    top: 6px;
    left: 120px;
}
.medium-view h3{
    font-size: 13px;
    font-family: 'Montserrat-SemiBold';
    color: #FFFFFF;
}
.high-view{
    position: absolute;
    bottom: 60px;
    right: 124px;
}
.high-view h3{
    font-size: 13px;
    font-family: 'Montserrat-SemiBold';
    color: #FFFFFF;
    -ms-transform: rotate(75deg);
    transform: rotate(75deg);
}
Java Script
window.onload = function () {
        var config = {
            type: 'gauge',
            data: {
                datasets: [{
                    data: [2, 4, 6, 8, 10],
                    value: 1,
                    backgroundColor: ['#e70100', '#ee4e00', '#ee9f00', '#9fee00', '#00b100'],
                    borderWidth: 2,
                }]
            },
            options: {
                responsive: true,
                title: {
                    display: false,
                },
                layout: {
                    padding: {
                        bottom: 30
                    }
                },
                needle: {
                    radiusPercentage: 2,
                    widthPercentage: 3,
                    lengthPercentage: 25,
                    color: 'rgba(0, 0, 0, 1)'
                },
            }
        };

        var ctx = document.getElementById('chart').getContext('2d');
        window.myGauge = new Chart(ctx, config);

        config.data.datasets.forEach(function (dataset) {
            dataset = randomValue(dataset.data);
        });

    };
1266